2019 LTE Cat-M1 Modem 8bit MCU Controller
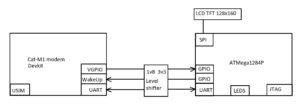
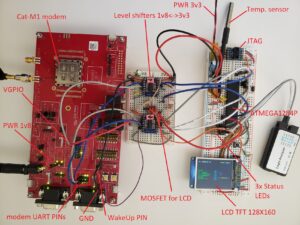
This project was half work half hobby as I was coding on weekends. I wanted to understand the modem better and to see the challenges developers were facing when developing a host controller for a low power modem. I’m familiar with Atmel chips, thus I picked an ATMega1284P 8bit MCU. There were a couple of reasons why I picked this MCU. First, the 128K Bytes flash was appealing – more flash more features -the other main benefit was JTAG support. I added a temperature sensor to send some meaningful data and an LCD display for debugging and to transfer images over Cat-M1 in downlink direction. Modem low power was triggered with asserting the DTR PIN and AT commands. The host MCU low power mode was done in SW with no RTC, utilizing ATMega’s internal 128K clock and periodic watchdog feature. The LCD was optional and of course was shut down during host low power demonstration. LCD power was controlled from the MCU through a MOSFET. Uni-directional level shifters were translating the GPIOs/UARTs to the correct levels. I was using opensource drivers for the temperature sensor (ds18b20) and for the LCD (st7735r). I implemented the UART handler from scratch, the trickiest part was handling the modem’s unsolicited AT commands with UART RX interrupts. I also implemented a command line interface so the user could run various demos and test cases. It is hard to debug without logging so I came up with a timer based interrupt logging feature. Events are timestamped with 100ms granularity.
The following video is showing a data transfer (temperature sensor reading and modem RSRP) over live Verizon Cat-M1 network to a server on the internet, listening on a predefined UDP socket. After the data transfer, modem low power mode is triggered through the command line interface.
What is in the video:
00:06 modem power up with Otii power supply00:19 modem is registered to Verizon, Cat-M1, B13 with APN “vzwinternet”, temperature reading is 24.9C , modem RSRP: -88dBm
00:27 MCU command line interface (CLI) logging feature with APIs, AT commands timestamped with 100ms accuracy
00:32 CLI “h” – help command is showing the available CLI commands
00:35 user initiated UL UDP transfer
00:38 Linux server is displaying the received UDP transfer. The received msg is showing the modem timestamp, RSRP and temperature sensor reading
00:45 a second UDP transfer is sent
00:58 user initiated modem power save mode request
01:07 DTR PIN is asserted via the CLI – modem may enter power save mode
01:54 modem enters power save mode
02:03 modem average power consumption is 1.68uA
2019 Greenhouse Temperature Control System
Temperature Controller MCU
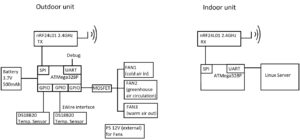
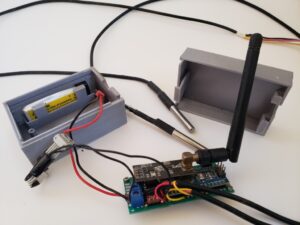
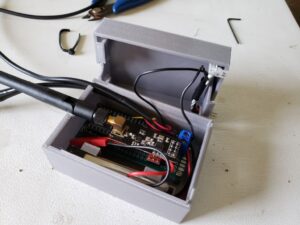
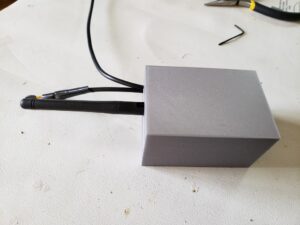
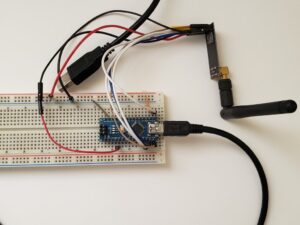
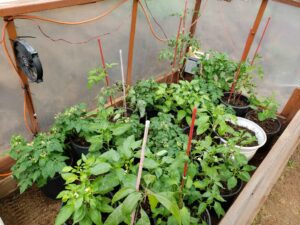
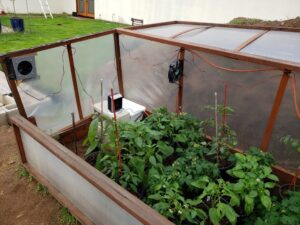
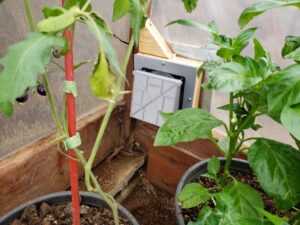
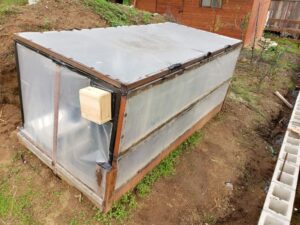
I’m an avid gardener. I like to grow my own veggies especially tomatoes and Hungarian peppers. I can grow my veggies from June till early December in a raised bed but winter months are too cold for this. I built a small home made 4×8′ greenhouse to see if it is worth investing into a proper, larger greenhouse. I quickly realized that even during winter months, it can get too hot inside the greenhouse during the day, but too cold during the night. So I needed some kind of temperature control system. I also wanted to add remote temperature measurement capability and I was also interested in low power design. I ended up using an Arduino Nano (ATMega328P) which had to be modified for low power application. I removed the regulator and the UART to USB chip, I also nuked the Arduino bootloader. I always program my Atmel chips via SPI with Atmel-ICE, there was no need for the Nano’s USB programmer. I added a couple of weatherproof ds18b20 temperature sensors (one to measure the temperature inside the greenhouse and the other one to measure the outside temp.) and a Nordic nrf24l01+ transceiver to send the temperature data to my Linux server. A GPIO PIN is turning on and off the 3 PC case fans through a MOSFET. The power is supplied externally for the fans and the Arduino board, sensors and the transceiver are powered with a 3.7V 500mAh LiPo battery.
ATMega328P has a great feature -Power-down Mode- when it comes to low power designs. While in low power mode, only an internal 128kHz Oscillator is running, the main external 16MHz Oscillator is turned off, but the watchdog is still running. Watchdog wakes up the MCU every 8 seconds (longest timeout), it increments and evaluates a counter then it goes back to power down mode. The wakeup cycle is in the micro seconds range. When the counter reaches the threshold, the MCU reads the temperatures and turns on the fans if the temperature is higher than 32C inside the greenhouse. If it is lower than 28C, the fan is turned off. Measurements are taken every 15mins, and in every 30mins the measurements are send to TX. Luckily, the MCU is retaining the PIN state with hardly any power loss while in Power-down Mode. So the MOSFET keeps the 12V power supplied to the fans until the PIN state changes (which maybe updated every 15 mins). A second Arduino Nano inside the house is listening on the same 2.4GHz channel and sends the measurements to the PC over UART.
Heating the greenhouse during the night is controlled with a separate, off the shelf heat mat thermostat (rated for 1000W) and a 500W ceramic heater. This keeps the temperature at least 14C during the night.
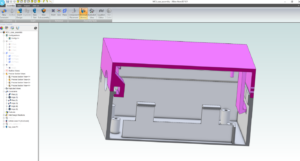
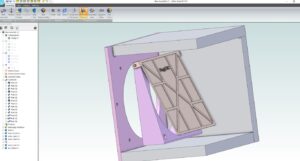
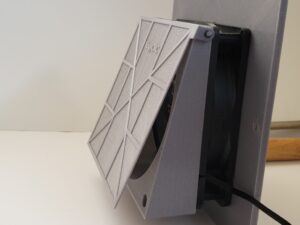
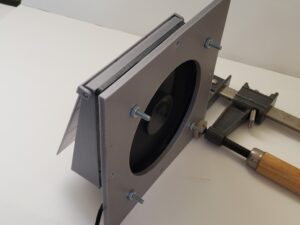
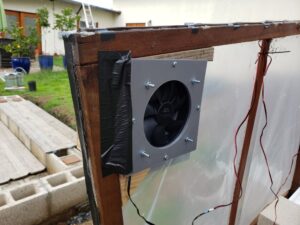
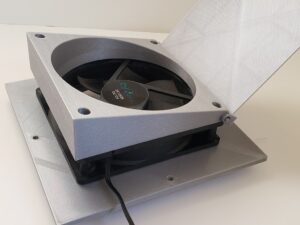
3D Printed Fan Mounting
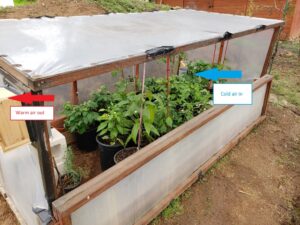
One fan is blowing the warm air out (top), another fan is sucking the colder air in (bottom), a third fan is ventilating the air inside the greenhouse.
MCU Power Consumption Measurement
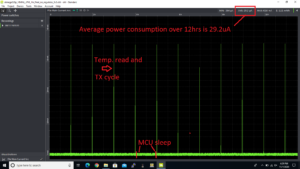
The first power chart (captured with OTii PS) is measuring the MCU, sensor, transceiver average power consumptions for 12hrs with a 1 hour interval between sensor readings and TX cycles. The MCU is in power down mode all the time and only wakes up for 2 seconds every hour. The average power consumption here is 29.2uA. I didn’t screen capture the 15 mins sensor reading and 30 mins TX cycle scenario, but with some code optimization the average power consumption is around 50uA on the final design. Thus my 500mAh battery should last at least for one year. [2020 Oct. update it did last for a year!]
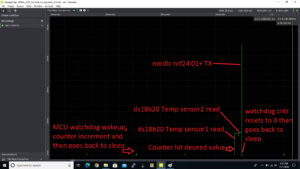
The seconds power chart is zooming in on a sensor measurement and TX transmission.
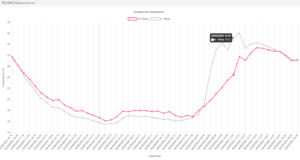
I wrote a small C code for the Linux server to timestamp, read, and store the temperature readings from the Indoor unit over USB. Data is presented with Apache and Chart.js.
2010 AVR32 devkit
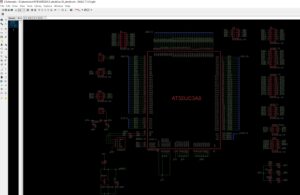
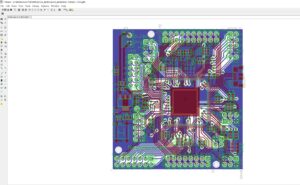
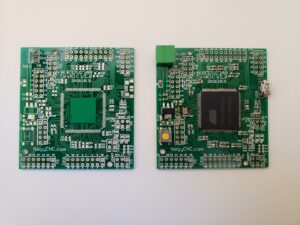
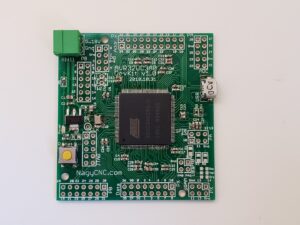
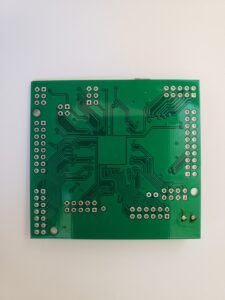
I had some RTOS projects in mind but no devkits were available for the AVR32 so I had to create one.
